

The affiliate marketing industry has seen rapid growth in recent years. The global market size of the affiliate marketing industry is around $18.72 billion in 2026, and more than 80% of brands worldwide now use affiliate marketing. Businesses can achieve the right revenue by understanding the right metrics.
If you own a business that manages a content-driven affiliate strategy or runs a full-scale partner programme, measurement goes far beyond monitoring clicks. In this blog, we will cover the essential metrics to track across your affiliate channel, from click-through rate to customer lifetime value. This blog will help you refine your business’s performance and make data-driven decisions.
Difference Between Benchmarks, KPIs, and Metrics
Affiliate marketing benchmarks, KPIs, and metrics are correlated, yet each has a distinct purpose. Metrics provide raw data, KPIs help track progress toward specific goals, and benchmarks offer external standards for comparing performance and measuring overall success.
Metrics
A metric is simply a quantitative measurement of any business activity or process. They are often at a tactical or operational level. Metrics can be anything individuals and businesses track, including clicks, time on site, impressions, and the number of affiliate links clicked.
KPIs (Key Performance Indicators)
KPIs are specialized metrics that directly connect to businesses’ and individuals’ strategic goals. These help companies understand how well their business or campaign is achieving its objectives. An effective KPI must be relevant, actionable, and aligned with the overall business strategy.
Benchmarks
Benchmarks can be reference points for companies to measure their performance. These can be internal, based on a business’s past results, or external, comparing a company’s performance to industry averages.
| Aspect | Metrics | KPIs | Benchmarks |
| Purpose | Describe performance data points (e.g., CTR, AOV, EPC) | Prove progress on strategic goals (e.g., target EPC or ROI) | Provide external or historical standards to compare against |
| Scope | Broad, operational, diagnostic | Narrow, outcome-focused, decision-driving | Comparative, context-setting, target-defining |
| Selection | Track many by default | Few, carefully chosen from metrics | Chosen by vertical, channel, and market |
| Examples | Clicks, CTR, conv. rate, AOV, EPC, CPA, retention | ROI/ROAS, revenue per click, sales per affiliate, active affiliates | CTR 0.5–1% avg; conversion ranges by vertical |
| How used | Monitor and diagnose funnel performance | Guide goals, budgets, and incentives | Set realistic targets and judge health |
| Relationship | Raw ingredients for KPIs | Subset of metrics aligned to goals | Inform KPI targets and evaluation |
Key Affiliate Marketing Metrics to Measure Success
The affiliate marketing success of businesses isn’t about the clicks and links. To improve sustainable performance, you must track essential metrics that indicate how effectively your content, campaigns, and affiliates are monetizing, converting, and scaling. Here are the major affiliate marketing metrics to measure your success:
1. Click-Through Rate (CTR)
Click-Through Rate (CTR) is the percentage of viewers who click an affiliate link on your web page after seeing it. This metric generally assesses the quality of your content and the effectiveness of your affiliate placements.
The formula to calculate CTR is CTR = (Clicks ÷ Impressions) × 100
CTR benchmarks can differ across industries, including affiliate marketing. If the click-through rate of your page is between 0.5% and 1%, it is considered average. However, if it exceeds 1%, it is considered a strong performance.
2. Average Order Value (AOV)
Average Order Value (AOV) measures the average amount customers spend each time they make a purchase through an affiliate link. It’s calculated by dividing total revenue by the number of orders, helping you track spending trends and transaction sizes.
The formula to calculate AOV is AOV = Total Revenue ÷ Number of Orders
The Average Order Value varies widely by industry and products. For instance, e-commerce brands might see AOVs of $50 to $200 or more. Affiliates in the e-commerce industry can generally experience 10% to 15% higher AOV than other marketing channels. It is due to the precise and targeted approach of affiliate marketing.
3. Revenue Per Visitor (RPV)
Revenue Per Visitor (RPV) reflects the conversion rate and average order value. It calculates the average revenue generated per website visitor by dividing total revenue by total unique visitors for a time span.
You can calculate RPV by following this formula: RPV = Total Revenue ÷ Number of Visitors
Revenue Per Visitor is not just about conversions or clicks. It provides the exact value each visitor adds. If your website’s traffic is high but your RPV is low, it generally means your audience quality is poor. RPV value varies by industry; however, the key rule is simple. Your RPV must always be higher than your cost per visitor or click to keep your business model profitable.
4. Cost Per Lead (CPL)
Cost Per Lead (CPL) measures the average amount spent to acquire one qualified lead. You can calculate these metrics by dividing the total campaign cost by the leads generated. CPL measures the efficiency of lead generation and the effectiveness of the budget.
The formula to calculate Cost Per Lead (CPL) is Total Cost of the Campaign ÷ Number of Leads Generated
CPL is crucial for businesses when affiliates focus on lead generation rather than direct sales. These metrics help brands evaluate how cost-effective their lead-based affiliate campaigns are. However, you should always remember that a lower CPL isn’t always better, as it depends on your industry’s profit margins.
5. Conversion Rate
Conversion Rate is the percentage of people who click on your affiliate links and proceed to complete the required action. These actions can be making a purchase or signing up for a service. Generally, conversion rates between 1% and 3% are considered normal, while top affiliates achieve 5% or higher.
The formula to calculate Conversion Rate is Number of Conversions ÷ Number of Clicks * 100
High conversion rates display that your affiliate channel not only brings traffic but also attracts the right audience who take meaningful actions. However, a low conversion rate suggests problems with traffic quality, offer relevance, or funnel alignment.
6. Earnings Per Click (EPC)
Earnings Per Click (EPC) displays how much you or your company earns on average every time someone clicks your affiliate link. These metrics blend both revenue and the number of clicks to calculate how efficiently your links are performing.
EPC also helps you compare different affiliate offers or programs side by side, making it easier to see which one provides the highest earnings for each visitor. If your Earnings Per Click (EPC) is higher than your cost per click, then your campaign is performing well.
7. Cost Per Acquisition (CPA)
Cost Per Acquisition (CPA) refers to the total expense spent to acquire a new customer through affiliate marketing, including commissions, network fees, and other related costs.
CPA plays an important role in your company’s profitability. You must ensure that the cost of gaining a customer through affiliates stays well below the value that the customer generates for your business.
Generally, CPA should be lower than your AOV (Average Order Value) multiplied by your profit margin. This is when your affiliate channel becomes revenue positive.
8. Return on Ad Spend (ROAS)
Return on Ad Spend (ROAS) shows how much revenue your company has earned for every dollar spent on affiliate ads or promotions, which includes any paid traffic efforts run by you or your affiliates.
The formula to calculate Return on Ad Spend (ROAS) is Revenue From Affiliate Marketing Ad Campaign ÷ Cost of Affiliate Marketing Ad Campaign
A ROAS of 4:1 is generally considered strong, which means you earn $4 for every $1 spent. This indicates how well your company’s paid affiliate campaigns are performing and whether your expenditures are justified. However, if the ROAS is low, it is a signal to optimize or reassign your budget.
9. New vs. Returning Visitor Conversion Rate
This metric compares conversion rates between first-time and returning visitors from affiliates. Depending on your business goals, you can aim for an even 50:50 split or focus more on returning visitors, like a 20:80 ratio. This all depends on your overall objectives and strategies.
Returning visitors to a company tend to convert more frequently than first-time users. However, returning visitors are 73% more likely to make a purchase compared to new visitors.
This metric displays engagement, loyalty, and whether your affiliate content drives visitors, who return and convert, not just one-time clicks.
10. Affiliate Link Click-to-Sale Time
This metric measures the average time a user takes to purchase after clicking an affiliate link. Once a company understands this metric, it will help it to set the right cookie or attribution window, track buyer behavior, and plan timely follow-ups.
However, if the gap between click and sale is long, you should consider engaging users repeatedly or extending your attribution period. The purchase timing varies by industry, because impulse buys may happen within minutes, while thoughtful shopping can take days or even weeks.
11. Mobile vs. Desktop Performance
Mobile versus desktop performance metrics analyze the performance of your affiliate channel across smartphones and desktops. Mobile traffic continues to grow globally; however, it often converts less efficiently, which makes it crucial to optimize for device-specific behaviors, such as UX, loading speed, and checkout flow. Smartphones drive around 58% of the total global internet traffic, while desktop users generally convert 1.5X to 2X better.
12. Average Commission Rate
The Average Commission Rate measures the percentage or fixed amount you pay affiliates for each sale or lead they generate. This metric plays a vital role in making your affiliate program appealing, attracting quality partners, and ensuring long-term profitability. If the commission rate is too low, you won’t be able to attract good affiliates; however, if it is too high, you may not profit.
The formula to calculate Average Commission Rate (ACR) is (Total Sales Revenue X Commission Rate) ÷ Total Sales.
The ACR generally ranges from 5% to 30%, depending on the industry. For example, it is around 5% in retail and e-commerce, and more than 20% for digital products.
13. Affiliate Program Activation Rate
The Affiliate Program Activation Rate measures the number of your registered affiliates who have actually started promoting your program after signing up.
Strong programs generally achieve activation rates around 10% or higher, while the best ones reach 50% or more. A high activation rate indicates that your onboarding process, affiliate support, and program appeal are working well. While a low rate suggests many inactive accounts that bring little to no value.
14. Affiliate Retention Rate
Affiliate Retention Rate reveals how many affiliates promote your program over time. Most programs generally maintain about a 30% retention rate, while the best ones achieve more than 80%.
The formula to calculate Affiliate Retention Rate (ARR) is (Number Of Affiliates At End of Period – New Affiliates Acquired) ÷ Number Of Affiliates At Start of Period.
A high affiliate retention rate shows steady traffic and consistent conversions, while a high churn rate reveals missed opportunities and additional costs. Retention also displays how satisfied affiliates are and how well your program supports them.
15. Affiliate Content and Link Placement Performance
The Affiliate Content and Link Placement Performance metric measures how effectively affiliate content, like blog posts, social media updates, and link placements, drives performance.
It helps individuals and companies identify which content types, placements, or creatives convert best, guiding more effective optimization for future campaigns.
You can use A/B testing to compare placements and content formats, and track click-through and conversion rates by placement type to refine your affiliate strategy.
16. Traffic Source Distribution
The Traffic Source Distribution metric shows how a company’s affiliate traffic is distributed across multiple sources, including blogs, social media, paid advertisements, and email campaigns.
Organic search and SEO account for around 50% of affiliate traffic. Paid Search and Social Media follow next with 15% and 10% traffic, respectively. This shows the importance of having a range of traffic sources.
This metric helps you direct your resources toward the most effective channels, where some channels may deliver better conversions or lower costs.
17. Customer Lifetime Value (CLV)
Customer Lifetime Value (CLV) calculates a company’s total revenue or profit it can expect to earn from a customer acquired through affiliates over the entire duration of their relationship.
The formula to calculate Customer Lifetime Value (CLV) is Average Purchase Value X Average Purchase Frequency X Average Customer Lifespan.
This metric helps you find out how much you can afford to spend on affiliate commissions or customer acquisition. A higher CLV means you can justify paying more per acquisition.
Affiliate Marketing Growth Rate Statistics
The global affiliate market size is about $18.72 billion in 2026 and is projected to grow at a CAGR of 17.14% from 2026 to 2032. It is expected to cross $48.92 billion by the end of 2032.
The affiliate market sales revenue in India is about $639 million in 2026. It is expected to grow at a CAGR of 8.9% from 2026 to 2033. The market sales revenue is projected to reach $1.2 billion by the end of 2033.
The table below showcases the affiliate market sales revenue of India from 2026 to 2033:
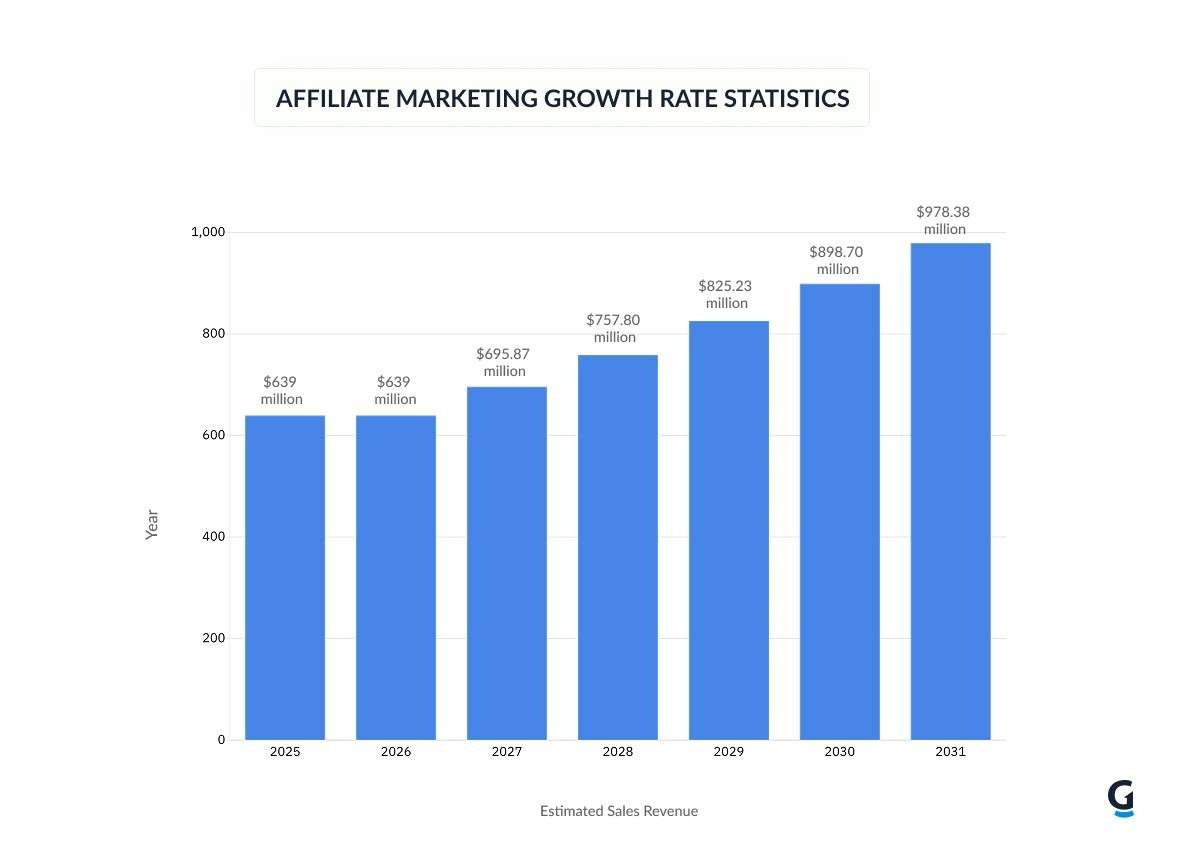
| Year | Estimated Sales Revenue |
| 2026 | $639 million |
| 2027 | $695.87 million |
| 2028 | $757.80 million |
| 2029 | $825.23 million |
| 2030 | $898.70 million |
| 2031 | $978.38 million |
| 2032 | $1.06 billion |
| 2033 | $1.16 billion |
- North America leads with accounting for over 20% of the global market with a revenue of $3.6 billion in 2026 and is expected to grow at a CAGR of 8.2% by the end of 2033.
- Europe and the Asia Pacific follow next in the list, accounting for more than 24.46% and 34.24% of the global revenue share, respectively, in 2026. In 2026, they generated approximately $4.5 billion and $6.3 billion in revenue, respectively.
Here is the table to show the regional revenue share of affiliate marketing revenue:
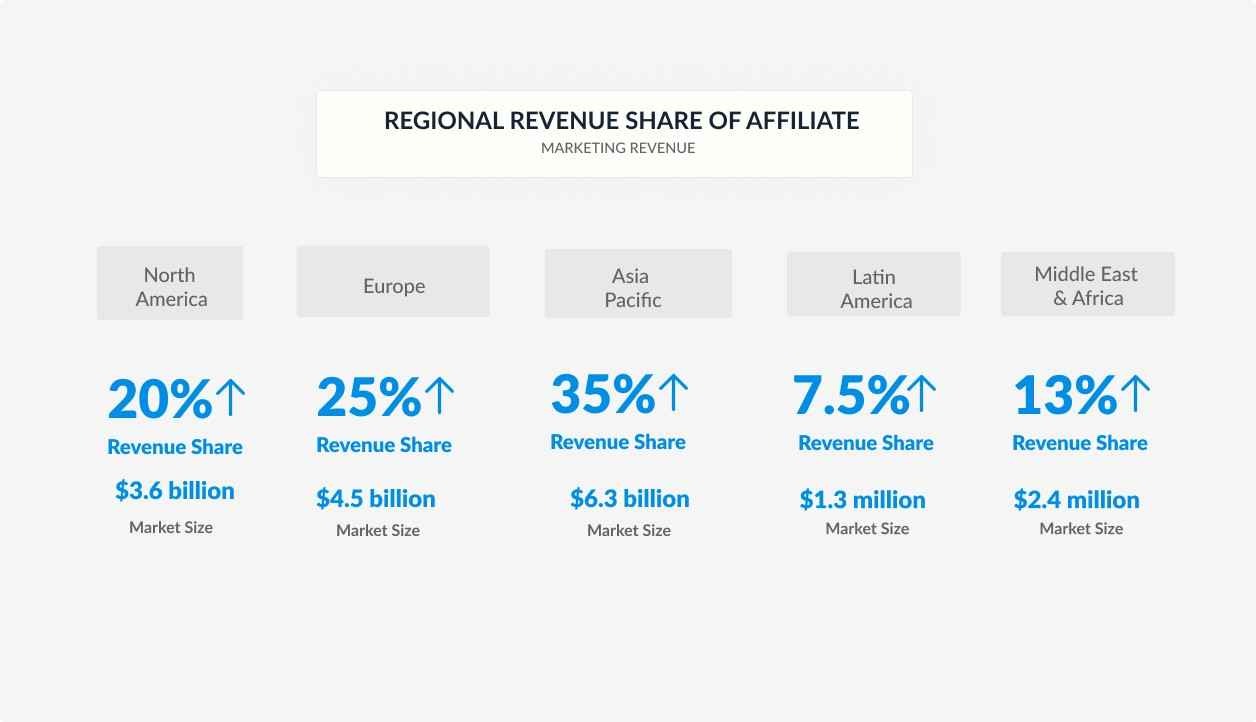
| Region | Revenue Share | Market Size |
| North America | 20% | $3.6 billion |
| Europe | 25% | $4.5 billion |
| Asia Pacific | 35% | $6.3 billion |
| Latin America | 7.5% | $1.3 million |
| Middle East & Africa | 13% | $2.4 million |
Affiliate Marketing Revenue Statistics
- The creative-driven affiliate revenue is expected to reach $1.3 billion by the end of 2026, driven by a surge in influencer collaborations and content-led campaigns.
- Experienced affiliates can easily earn up to 100 times more than beginners when equipped with the right strategies and tools. This highlights a potential 100X income gap between newcomers and experts.
- An affiliate marketing manager can earn an average yearly salary of $81,697. It reflects the increasing demand for affiliate marketing professionals.
- More than 50% of total affiliate marketing revenue comes from online publishers, with over half of them relying on it as their primary source of income.
Wrapping Up
Tracking metrics for individuals and companies is just the beginning. However, the real value comes from using metrics to set actionable KPIs and measuring them against relevant benchmarks. When aligned with strategic goals, these insights can help you identify gaps, optimise weak areas, and improve decision-making. Businesses can regularly review affiliate marketing metrics to provide a clearer view of partner performance, traffic quality, and profitability trends. By using these insights, marketers can polish their strategies, strengthen affiliate relationships, and drive scalable growth of their programs.
FAQs
Which affiliate marketing is best?
The best affiliate marketing programs are those with strong brands, reliable tracking, and good payouts. In India, popular options include Amazon Associates, Flipkart Affiliate, vCommission, EarnKaro, GrabCash, and other reputable networks that cover a diverse range of products and niches, helping affiliates effectively monetize their audience.
Which affiliate is best for beginners?
For beginners, simple and widely used programs like Amazon Associates and ClickBank, along with beginner-friendly networks, provide easy entry without strict requirements. These platforms let new users start promoting products and earning commissions with straightforward onboarding and minimal technical setup.
How do affiliates earn money?
Affiliates earn money by promoting products or services using special referral links. When someone clicks their link and makes a purchase or completes a defined action, the affiliate receives a commission. Their earnings depend on conversions, product prices, and the network’s payout structure.
What is the future of affiliate marketing in India in 2026?
Affiliate marketing in India is expected to experience significant growth by 2026 due to the expansion of e-commerce and digital content. With increasing internet penetration and more platforms offering affiliate programs, creators and businesses will find new opportunities to generate passive income and monetize audiences.