

In 2016, Mobile web browsing overtook desktop browsing for the first time, which became a wake-up call for businesses. Many companies started optimizing their website to be mobile-friendly. And currently, mobile devices account for 62.73% of the global website traffic. More and more people are using mobile phones, which is impacting their shopping habits. As an affiliate marketer, you need to know the differences between desktop and mobile traffic, so you can understand how the visitors are behaving. Let us take a look at some important numbers that can help you build more successful campaigns.
Desktop vs. Mobile Traffic Statistics (Top Picks)
- As of Q2 2025, the mobile devices (excluding tablets) accounted for 62.73% of global website traffic.
- In October 2025, mobile devices held a 48.92% share of internet usage worldwide, with desktops slightly ahead at 49.79%, and tablets accounting for 1.28% of the total market share.
- Mobile traffic continues to lag behind desktop in conversion performance, converting shoppers at just 2.25%, compared to 4.81% on desktop. Even tablet fares better, converting at 4.06% on average.
- More than half (53%) of mobile visits are abandoned if a web page takes longer than three seconds to load.
- 80% of social media browsing happens on mobile devices.
- The United States Mobile traffic market share was the largest in September 2025, with 56.54% of the traffic coming from mobiles and 41.29% coming from desktops.
- India’s mobile traffic market share was 75.07% in September, with desktop traffic share at 24.35%.
Global Internet and Mobile Penetration
According to the data provided by the United Nations, the world population is 8.20 billion. Out of over 8 billion people, 5.78 billion people use a mobile phone, which is 70.5% of the world population. 5.56 billion people use the internet (As of 2025), with 5.24 billion social media user identities. As compared to 2024, more than twice as many people are using the internet today as there are people who remain offline. And about 80% of all social media activity worldwide takes place on mobile devices.
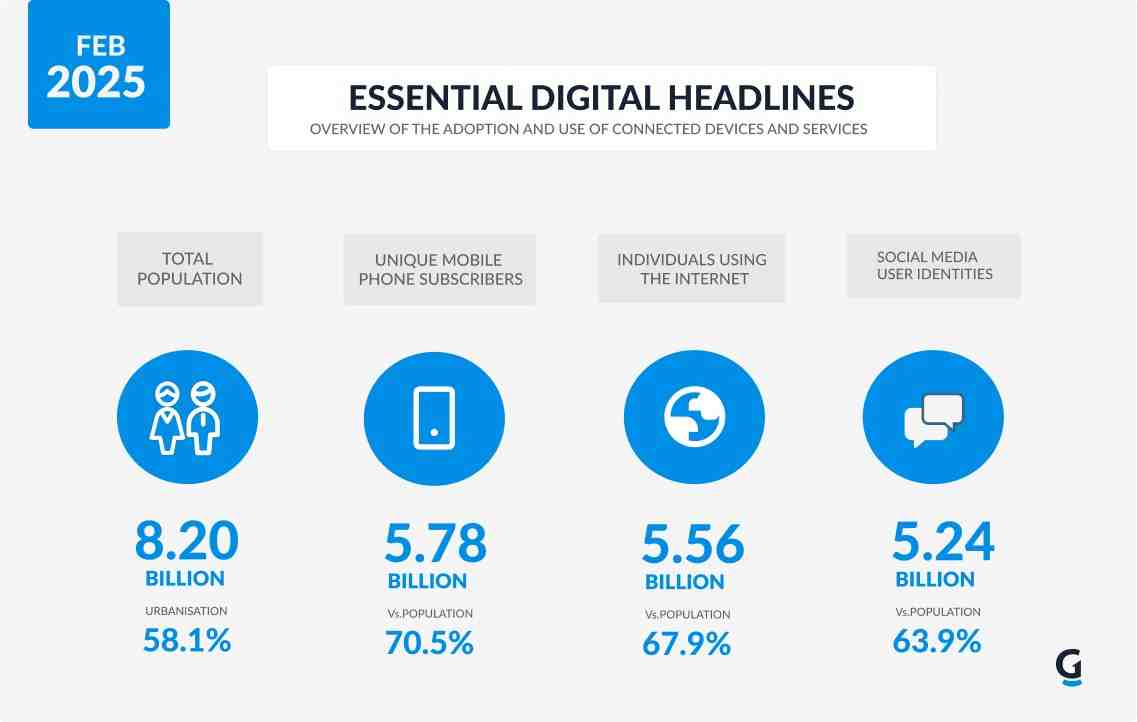
Source: Data Reportal, Techjury
Mobile Device Website Traffic Statistics
The mobile device website traffic has grown steadily over the years. While it has seen occasional dips over a certain period, people are still very much using their mobiles to access websites. Since 2016, mobile devices have consistently accounted for around 50% of the global website visits. As of Q2 2025, the mobile devices (excluding tablets) accounted for 62.73% of global website traffic. This is likely to continue with expanding mobile infrastructure and more user adoption. Here’s a table describing the growth of mobile device website traffic from 2015 to 2015.
| Quarter | Mobile Device Traffic |
| Q1 2015 | 31.16% |
| Q2 2015 | 32.85% |
| Q3 2015 | 38.38% |
| Q4 2015 | 38.43% |
| Q1 2016 | 39.47% |
| Q2 2016 | 42.16 |
| Q3 2016 | 44.69% |
| Q4 2016 | 48.33% |
| Q1 2017 | 50.03% |
| Q2 2017 | 52.21% |
| Q3 2017 | 52.99% |
| Q4 2017 | 51.12% |
| Q1 2018 | 51.77% |
| Q2 2018 | 51.89% |
| Q3 2018 | 52.4% |
| Q4 2018 | 47.19% |
| Q1 2019 | 48.71% |
| Q2 2019 | 48.91% |
| Q3 2019 | 51.51% |
| Q4 2019 | 52.6% |
| Q1 2020 | 51.92% |
| Q2 2020 | 51.53% |
| Q3 2020 | 50.81% |
| Q4 2020 | 52.2% |
| Q1 2021 | 54.8% |
| Q2 2021 | 55.09% |
| Q3 2021 | 55.78% |
| Q4 2021 | 54.4% |
| Q1 2022 | 55.79% |
| Q2 2022 | 58.99% |
| Q3 2022 | 59.54% |
| Q4 2022 | 59.16% |
| Q1 2023 | 58.03% |
| Q2 2023 | 53.42% |
| Q3 2023 | 54.34% |
| Q4 2023 | 54.67% |
| Q1 2024 | 59.34% |
| Q2 2024 | 60.12% |
| Q3 2024 | 61.85% |
| Q4 2024 | 62.54% |
| Q1 2025 | 62.39% |
| Q2 2025 | 62.73% |
Source: Statista
Mobile vs. Desktop Market Share Worldwide
As per the latest data from StatCounter, the global market share of devices accessing the internet is nearly evenly split between desktops and mobile devices. Desktops lead slightly with 49.79%, while mobiles follow closely behind at 48.92%. Tablets constitute the smallest segment, accounting for just 1.28% of the total market share. The mobile market share has seen a steady decline in the past four months. It has dropped from 63.13% in June 2025 to 48.99% in October 2025. Whereas the desktop share has increased steadily from 35.24% in June to 49.72% in October 2025, a 14.48% jump in just four months. Thus, focusing on just mobile optimization is not going to cut it; websites need to be optimized for viewing on all devices, like mobiles, desktops, and tablets.

Source: Statcounter
Mobile vs. Desktop Market Share India
In India, mobile devices dominate internet access with a commanding market share of 76.17% as of October 2025. This indicates that over three-quarters of web traffic originates from mobile phones, emphasizing the country’s strong preference for mobile connectivity. Desktop usage, by contrast, accounts for just 23.32%, reflecting a significantly smaller portion of internet activity. Tablets make up a minimal fraction, with only 0.5% market share.
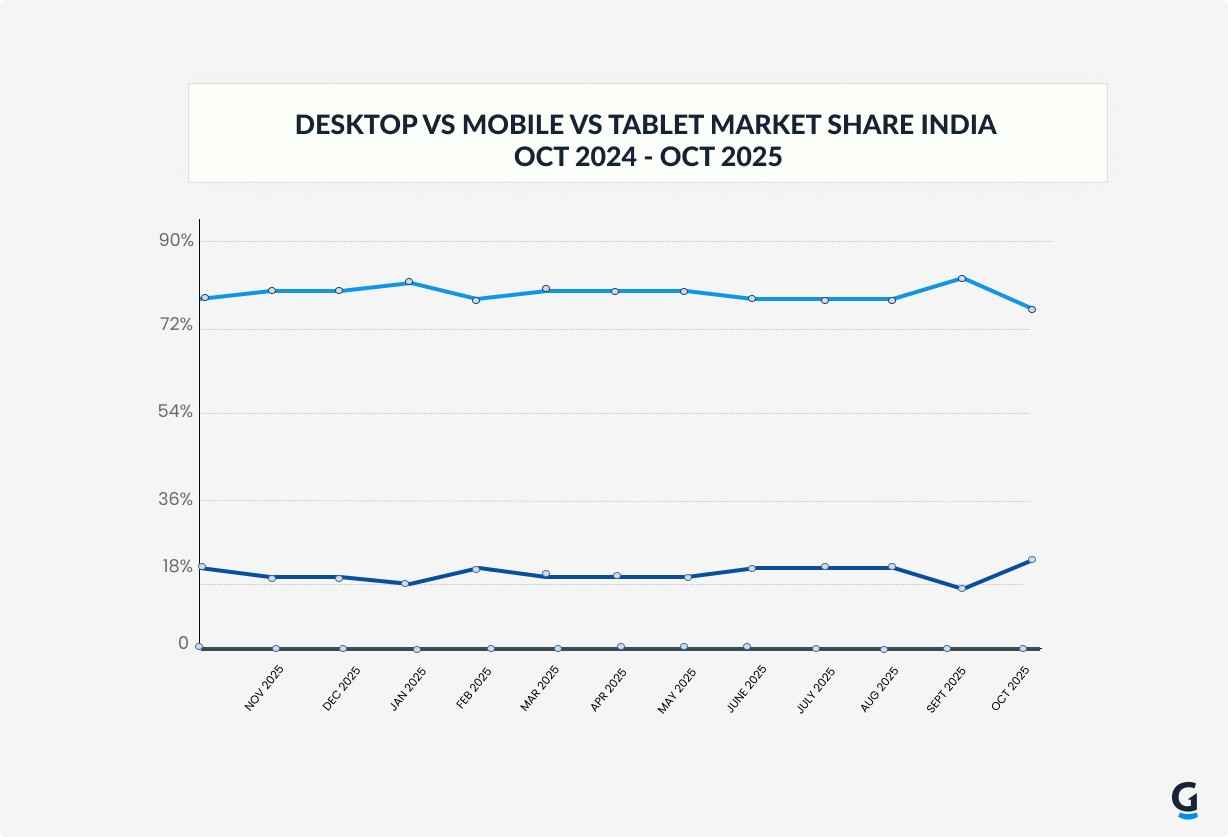
Source: Statcounter
Mobile vs. Desktop Click-Through Rates
There is a difference between how mobile users interact with affiliate links and how desktop users treat affiliate links. Mobile devices (1.5%) have higher click-through rates than desktops (0.9%). But in the next section, you can see that even though the CTR for mobile devices is higher than desktops, desktops do have a higher conversion rate.
| Device Type | Average CTR |
| Mobile | 1.5% |
| Desktop | 0.9% |
Source: 50Folds
Mobile vs. Desktop Traffic Conversion Rates
While mobile shopping is still massive, the mobile conversion rates are lower than the desktop conversion rates. Here are the conversion rates on various devices:
| Device Types | Conversion Rates |
| Mobiles | 2.25% |
| Desktops | 4.81% |
| Tablets | 4.06% |
Mobile conversion rates are lowest because of limited screen size makes navigation, form-filling, and checkout processes cumbersome. Moreover, mobile users usually browse during in-between moments with less intent on completing the purchase. Site speed also affects the conversion because over 53% of mobile visitors abandon sites that take longer than 3 seconds to load.
Source: The Drum, Marketing Dive, Smart Insights
| NOTE: Smartphone conversion rates for retail average around 3%, but conversion is higher during seasonal sales in November and December. |
Mobile Web Traffic Share According to Device Type
Android controls the majority of mobile web traffic with a share of approximately 72.6%, while Apple’s iOS accounts for about 27%. Together, these two operating systems make up nearly 100% of the global mobile web traffic market in 2025. Affiliate can tailor their campaigns primarily for Android and iOS.
| Rank | Device Type | Share | Change over the Previous Year |
| 1 | Android | 73.49% | +3.01% |
| 2 | Apple | 26.04% | -2.76% |
| 3 | Samsung | 0.31% | -0.6% |
| 4 | KAI | 0.03% | -0.11% |
| 5 | Other | 0.13% | -0.8% |
Source: Exploding Topics
Optimal Mobile Traffic Browsing Characteristics
According to a study by Scispace, it is mentioned that there are certain elements that impact visitor behavior and mobile traffic. There are ways you can improve your website and increase the conversion rates.
| Aspect | Description | Implication for Affiliates |
| Dwell Time Range | Typically between 2 and 70 seconds | Content and CTAs should fit within typical engagement windows |
| Webpage Size | Mobile pages vary significantly, typically between 60 KB and 1500 KB in size. | Optimize page size to reduce load times and user abandonment. |
| Page Load Time | Expected to be under 15 seconds; over 10 seconds is perceived as unresponsive, leading to session abandonment. | Prioritize speed optimizations for mobile pages to reduce bounce rates. |
| Session Behavior | Users visit multiple pages in a session with varying dwell times; session size is better measured by time than by bytes. | Create smooth navigation and seamless transitions between pages. |
Source: Scispace
Mobile vs Desktop Traffic Market Share by Countries
Countries like Indonesia, Japan, and India show very high mobile usage, above 75%, reflecting mobile-first markets where smartphones are the primary internet access devices. Developed countries such as the United States, Canada, Australia, and parts of Europe, like Germany and France, still show significant desktop presence, with desktop usage close to or exceeding 40%. Affiliate targeting countries with high mobile usage should prioritize mobile-optimized content and campaigns. While in countries with balanced or desktop-leaning traffic, a hybrid approach addressing both device types would be optimal.
| Country | Mobile | Desktop | Tablet |
| Japan | 75.4% | 22.6% | 2% |
| Indonesia | 76.95% | 21.83% | 1.22% |
| India | 75.07% | 24.35% | 0.58% |
| Philippines | 72.43% | 26.43% | 1.14% |
| Italy | 70.61% | 28.06% | 1.34% |
| Germany | 67.84% | 30.27% | 1.89% |
| United Kingdom | 67.33% | 29.92% | 2.74% |
| Brazil | 67.06% | 32.2% | 0.75% |
| France | 66.4% | 31.56% | 2.05% |
| Argentina | 63.69% | 35.84% | 0.47% |
| United Arab Emirates | 58.52% | 40.32% | 1.15% |
| Australia | 58.05% | 39.56% | 2.39% |
| Canada | 57.66% | 39.31% | 3.03% |
| United States | 56.54% | 41.29% | 2.17% |
| Singapore | 50.52% | 47.83% | 1.65% |
Source: Similarweb
Desktop Website Traffic Statistics
The Desktop website traffic has decreased from 68.84% (including tablets) in 2015 to 37.27% in 2025. The numbers show that there was a steady increase in mobile traffic share over the decade, with desktop traffic declining correspondingly. Desktop traffic remains significant, but has become the minority share of global website visits.
| Quarter | Desktop Website Traffic |
| Q1 2015 | 68.84% |
| Q2 2015 | 67.15% |
| Q3 2015 | 61.62% |
| Q4 2015 | 61.57% |
| Q1 2016 | 60.53% |
| Q2 2016 | 57.84% |
| Q3 2016 | 55.31% |
| Q4 2016 | 51.67% |
| Q1 2017 | 49.97% |
| Q2 2017 | 47.79% |
| Q3 2017 | 47.01% |
| Q4 2017 | 48.88% |
| Q1 2018 | 48.23% |
| Q2 2018 | 48.11% |
| Q3 2018 | 47.6% |
| Q4 2018 | 52.81% |
| Q1 2019 | 51.29% |
| Q2 2019 | 51.09% |
| Q3 2019 | 48.49% |
| Q4 2019 | 47.4% |
| Q1 2020 | 48.08% |
| Q2 2020 | 48.47% |
| Q3 2020 | 49.19% |
| Q4 2020 | 47.8% |
| Q1 2021 | 45.2% |
| Q2 2021 | 44.91% |
| Q3 2021 | 44.22% |
| Q4 2021 | 45.6% |
| Q1 2022 | 44.21% |
| Q2 2022 | 41.01% |
| Q3 2022 | 40.46% |
| Q4 2022 | 40.84% |
| Q1 2023 | 41.97% |
| Q2 2023 | 46.58% |
| Q3 2023 | 45.66% |
| Q4 2023 | 45.33% |
| Q1 2024 | 40.66% |
| Q2 2024 | 39.88% |
| Q3 2024 | 38.15% |
| Q4 2024 | 37.46% |
| Q1 2025 | 37.61% |
| Q2 2025 | 37.27% |
Source: Statista
Desktop vs. Mobile Usage Throughout the Day
In the table below, we explain how mobile and desktop devices are used differently throughout the day and for different purposes.
| Usage Aspect | Mobile Traffic | Desktop Traffic | Implications for Affiliates |
| Daily Usage Pattern | Consistent usage throughout the day and night due to portability and on-the-go access | Concentrated during business hours (7 AM to 7 PM) | Run mobile campaigns 24/7; focus desktop campaigns on business hours |
| Peak Purchase Time | Spread over the day with flexible browsing | Peaks around typical business/work hours (e.g., 2 PM in Switzerland) | Optimize time-based targeting by device |
| User Demographics & Trust | Younger, dynamic users; less trust, more casual browsing | Older demographics; higher trust in desktop for serious transactions | Segment campaigns by age and trust level |
| Engagement | Shorter sessions, higher bounce rates, but broader reach | Longer sessions, more pages per visit, lower bounce rate | Use quick-impact ads for mobile and detailed content for desktop |
| Conversion Rate | Lower rates due to usability challenges and distractions | Higher rates, preferred for complex tasks and checkout | Mobile optimization critical; desktop suitable for big-ticket or detailed conversions |
According to the patterns above, affiliates should run mobile campaigns around the clock to increase reach, while focusing desktop campaigns on business hours for higher conversion potential. For casual and entertainment offers, you can use mobile marketing, but for professional verticals like finance, where trust matters, desktop marketing is the way.
Source: Propeller Ads
High-Performing Verticals and Geographies for Mobile and Desktop Campaigns
Mobile campaigns perform best in regions like North America, Europe, LATAM, Asia, and Africa. iGaming, Extensions, eCommerce, Finance, and Games are some mobile verticals with strong performance. Desktop traffic is suitable for business-related and forms-heavy campaigns. Popular desktop verticals include iGaming, iOS, and Android apps.
| Device Type | Vertical | Top Geographies |
| Mobile | Extensions | North America: US, CA; Europe: GB, DE, IT, ES, FR; Australia: AU |
| Mobile | iGaming | US, BR, CL, PE, KE, NG, ZA, EG, IN, PH, GB, IT, NL, CA, DE, FR, NZ, ID, SE, PH, MX |
| Mobile | eCommerce | US, ID, PL, DE, PH, TH, MY, GB, KR, IT, FR |
| Mobile | Finance | Europe: DE, FR, ES, GB, CZ; Africa: NG, ZA; Asia: IN, JP, TR, TH, ID, PH, MY, KR, PK; LATAM: BR, MX |
| Mobile | Games | PL, DE, US, TR, FR, HU, VN, CZ |
| Desktop | iGaming | BR, PH, VN, ID, ZA, IN, TH, MY, ZM, AO, CO, MZ, NG, CI, PE, CM, KE, EC, CD, MW, ML, TZ, CL, EG, GH |
| Desktop | iOS Apps (VPNs) | BR, MX, SA, KR, PH, EG, TR, JP |
| Desktop | Android apps | PH, IN, ID, BR, TH, ZA, NG, MX |
| Desktop | Finance | CZ, IN, GR, HU, EG, NG, SA, KE |
| Desktop | e-Commerce | TH, PH, ID, MY, VN, SG, JP |
| Desktop | Mobile Content | ID, NG, CL, MY, PH, CM, SN, KE, DZ, GH, CD |
Source: Propeller Ads
Bonus: Mobile Vs Desktop Traffic Statistics
- As of 2025, adult internet users now spend an average of 6 hours and 38 minutes online each day, which is actually 2 minutes less than last year.
- Younger users aged 16 to 24 spend the most time on the Internet, with 7 hours 23 minutes, while the older generations aged 65+ spend almost 4 hours on the Internet.
- Younger groups spend more time on mobile devices, while the older groups lean more toward desktops and linear TV.
- Among internet users aged 16 to 34, social media ads are the leading channel for brand discovery, yet less than one-third of respondents in this group actually select social ads as their primary source for finding new brands or products.
- For audiences aged 35 and older, search engines become the top source for finding brands and products, with TV ads ranking second, while social media ads drop in importance.
- 7 out of 10 customers prefer recommendations over traditional Ads, they say they are more likely to trust recommendations from family, friends, over brands themselves.
Source: Datareportal, GrabCash
Wrapping up
We hope these numbers helped you understand the differences between desktop and mobile traffic, and affiliates need to strategize accordingly. While Mobile traffic dominates, desktop traffic converts more. To create the smartest campaigns, you need to embrace both worlds. You need to tailor messages and creatives that fit how people use their devices. Keep a close eye on the evolving trends and create marketing strategies that convert.