
| Quick Summary: India has crossed 1.02 billion internet users and somewhere between 650 million and 700 million active social media users, spending upwards of 2.4 hours online daily. Instagram overtook Facebook as the country’s top platform in 2026. With 750 million smartphones in use and adults aged 18-35 the most active group. Social media has become the key territory for affiliate marketers because this is where Indian shoppers discover deals. |
Picture this: every time you unlock your phone, so do hundreds of millions of other Indians. And they do the exact same thing. Most of them head straight for Instagram, YouTube, or Facebook. India’s smartphone count has crossed 750 million, internet users have topped the billion mark, and the average person here spends well over two hours a day scrolling. That’s not idle time. It’s browsing time, comparison time, and increasingly becoming shopping time. For anyone building affiliate content, this shift matters: the moment before someone buys something now often starts with a scroll, not a search. Here’s what the numbers actually say, and what they mean for you.
Key Statistics on Social Media Users
- India now has 1.02 billion internet users as of September 2025, up from just 250 million in 2014 (Reuters)
- 750 million active smartphones make India the world’s second-largest smartphone market.
- Internet penetration in India has hit 76.59% of the population (pib.gov)
- Social media penetration in India stands at 64.1%, putting the active user base between 650-700 million (Statista)
- The average Indian spends over 2.4 hours a day on social platforms (DataReportal)
- Adults aged 18-35 are the most active age group across every major platform
- India has 403 million users on Facebook, making it the largest Facebook audience in the world (as of October 2025)
- Facebook’s market share still dropped from 46.7% to 21.67% between June 2025 and June 2026, while Instagram climbed from 36.48% to 42.44% to take the top spot (Statcounter).
- YouTube leads with 500 million users in India, representing 34.1% of the population. Followed by Instagram, which holds 481 million users (32.8%). (Data Reportal)
How Many Internet Users Are There in India in 2026?
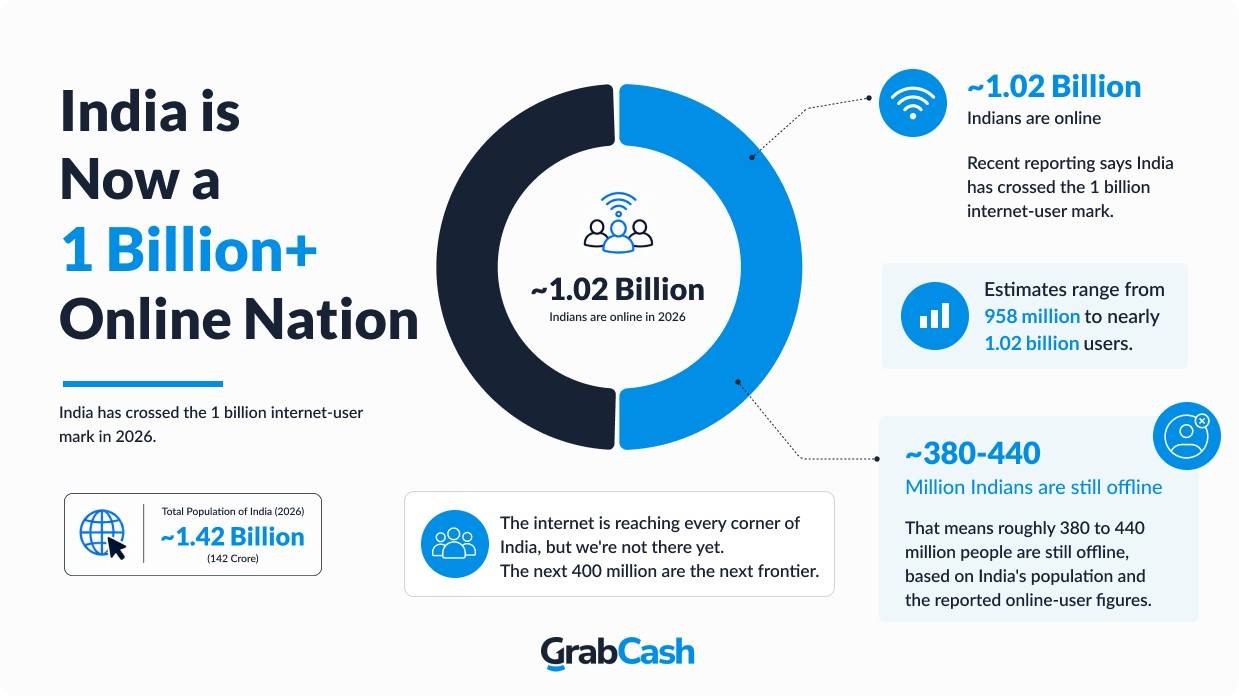
In 2026, around 1.02 billion Indians are online. Recent reporting says India has crossed the 1 billion internet-user mark, with estimates ranging from 958 million active users to nearly 1.02 billion users depending on the source and timing.
The numbers are up from 250 million in 2014, which means India added roughly 770 million internet users over that period. But still roughly 380 to 440 million people are offline, based on India’s population and the reported online-user figures.
India remains one of the world’s largest online markets, and internet access continues to expand quickly across rural and urban areas.
Source: Reuters and Data Reportal
How Many People in India Own a Smartphone?
Smartphones aren’t a luxury item in India anymore; they’re the default. 750 million active devices put the country in second place globally, right behind China, and the numbers behind that figure back it up in a way that’s almost hard to believe if you’re old enough to remember 2G buffering.
The government’s own Comprehensive Modular Survey on Telecom (2025) found that 85.5% of Indian households now own at least one smartphone. Split that by geography and the story gets even more interesting: urban households sit at 91.3%, rural at 82.1%, a gap that’s shrinking fast. Among 15-29 year-olds specifically, smartphone ownership climbs even higher: 97.6% in urban areas, 95.5% in rural ones.
| Category / Demographic | Urban (%) | Rural (%) | Overall / Total |
| Overall Household Smartphone Ownership | 91.3% | 82.1% | 85.5% |
| Youth Smartphone Ownership (Aged 15–29) | 97.6% | 95.5% | — |
Takeaway for affiliate marketers: If your audience is under 30, you’re basically talking to someone who already has a smartphone in hand; the question isn’t whether they’re online, it’s what they’re doing there.
Source: Ministry of Statistics & Programme Implementation
How Many People Use Social Media in India and How Much Time Do They Spend
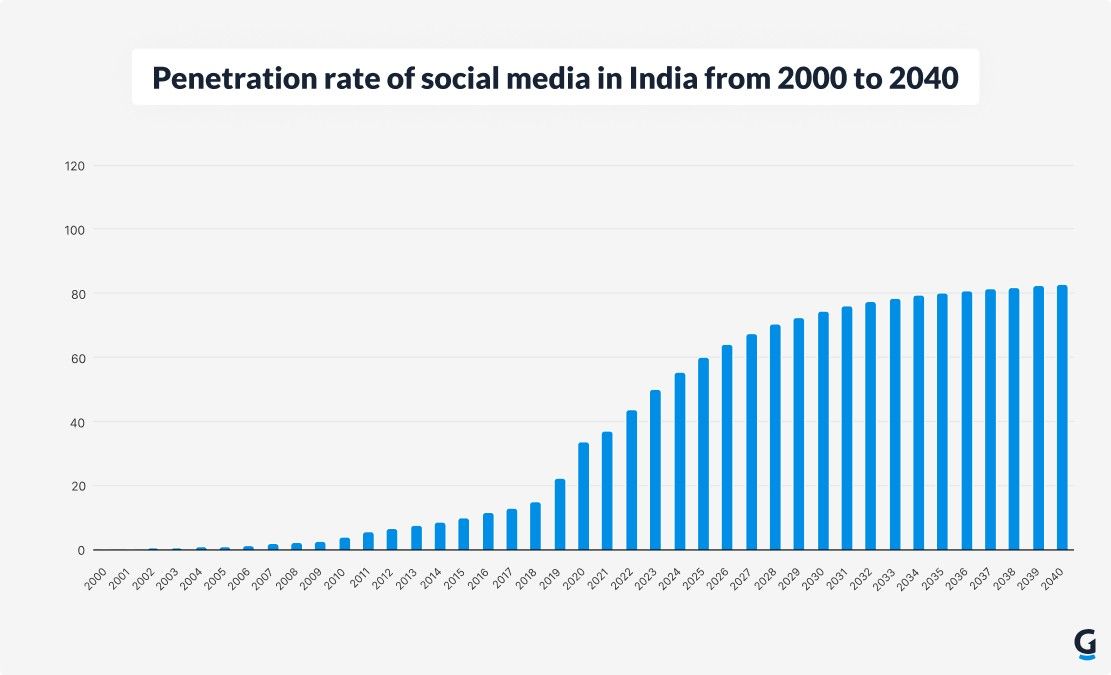
Social media penetration in India has crossed the halfway mark of the population, and it’s still climbing. Statista puts the current rate at 64.1%, which translates to somewhere between 650 and 700 million active users scrolling, posting, and shopping across platforms daily.
What makes this worth watching is the trend line, not just the snapshot. Statista’s own forecasting shows penetration rising by 22.4 percentage points between 2023 and 2028, on track to cross 83% by the end of that stretch. That’s not a slow crawl; that’s a country adding tens of millions of new social media users every year.
Time spent tracks the same upward curve. The average Indian spends over 2.4 hours a day on social platforms, per DataReportal, enough time to scroll past a dozen product mentions, influencer hauls, and flash-sale posts in a single sitting.
Takeaway for affiliate marketers: With penetration still rising and nowhere near saturation, the chances of the audience discovering deals through social media are going to increase in the coming years; the earlier you build that discovery-to-checkout habit, the more of that growth you capture.
Source: Statista and Data Reportal
Time Spent on Social Media by Platform (Global Data)
Not all scrolling is equal. Some platforms hold attention for a few minutes; others swallow entire evenings. Looking at global daily active user averages gives a clear sense of where that attention concentrates.
| Platform | Time per Daily Active User |
| TikTok | ~95 minutes |
| YouTube (incl. Shorts) | ~75 minutes |
| ~55 minutes | |
| ~33 minutes | |
| Snapchat | ~30 minutes |
| X (Twitter) | ~30 minutes |
| ~25 minutes | |
| ~17 minutes | |
| Threads | ~15 minutes |
| ~14 minutes |
Note: These are global daily-active-user averages, not India-specific figures. TikTok’s global dominance is undeniable, but it still remains banned in India. So Instagram Reels and YouTube’s Shorts formats are the closest equivalent for the short-video format.
Takeaway for affiliate marketers: Time-per-session tells you how deep you can go with content. A platform where users spend 55+ minutes a day can support a longer product comparison or a detailed review; a platform where they spend 15 minutes needs a single, scroll-stopping deal call-out. Match your content format to how long that platform actually holds attention, not to how much content you’d like to publish there.
Source: Conbersa, How Much Time Do People Spend on Social Media in 2026?
Who Uses Social Media in India? Age and Gender Breakdown
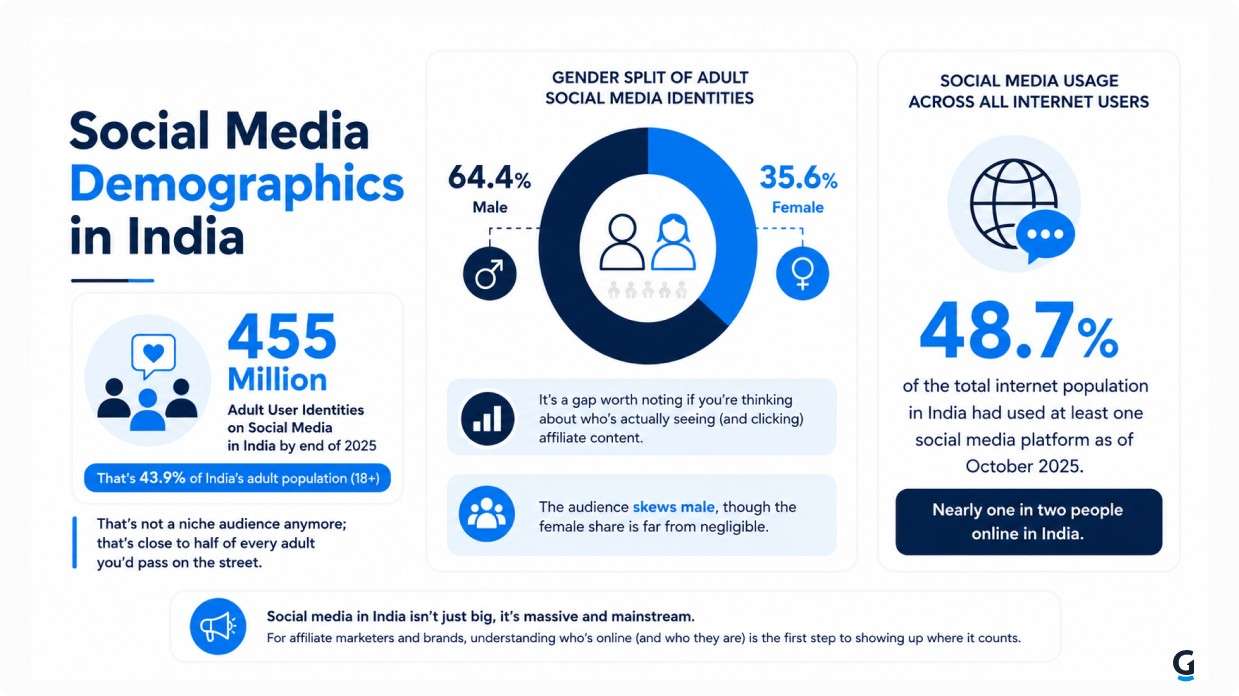
By the end of 2025, 455 million adult user identities- that’s 18 and above were active on social media in India, covering 43.9% of the country’s adult population. That’s not a niche audience anymore; that’s close to half of every adult you’d pass on the street.
The gender split tells its own story: 64.4% of these identities are male, while 35.6% are female. It’s a gap worth noting if you’re thinking about who’s actually seeing (and clicking) affiliate content. The audience skews male, though the female share is far from negligible.
Zoom out to the full internet population, regardless of age, and 48.7% had used at least one social media platform as of October 2025, nearly one in two people online in India.
Takeaway for affiliate marketers: With a male-leaning, adult-heavy audience this size, the deals and categories most likely to convert are the ones this specific demographic already shops for. Keep this in mind before you assume your affiliate picks fit everyone equally.
Source: Data Reportal (2026)
Time Spent by Age Group on Social Media (Worldwide)
We know who’s scrolling in India; now let’s look at how long they’re likely to stick around once they open the app. This next data set is global rather than India-specific, but it’s still useful: it shows how the exact age groups making up India’s social media audience behave once they’re online.
| Age Group | Average Daily Time | Dominant & Key Platforms | Usage Notes & Trends |
| 16–24 | ~3 hours/day | TikTok, Instagram, Snapchat | TikTok and Instagram dominate; Snapchat stays heavy; Facebook usage is close to zero. |
| 25–34 | ~2 hours 30 minutes/day | Instagram, TikTok, LinkedIn, YouTube Shorts | Instagram and TikTok lead; LinkedIn enters the mix for working users; YouTube Shorts is significant. |
| 35–44 | ~2 hours 10 minutes/day | Facebook, Instagram, YouTube, TikTok | Facebook, Instagram, and YouTube dominate; TikTok usage is growing but still lags behind. |
| 45–54 | ~1 hour 50 minutes/day | Facebook, Instagram | Facebook is the single biggest time sink, with Instagram as a secondary platform. |
| 55–64 | ~1 hour 15 minutes/day | Facebook, YouTube | Facebook and YouTube dominate this age bracket. |
| 65+ | ~45 minutes/day | Facebook accounts for the overwhelming majority of time spent online. |
Takeaway for affiliate marketers: Your affiliate content needs a different platform strategy depending on which age group you’re targeting. If you’re writing for 18-34 year-olds: India’s most active social demographic, Instagram is where the deepest engagement happens, and it’s worth leaning into. If a brand or deal leans toward an older, more established buyer, Facebook still earns attention time from that group, even though its overall market share has fallen.
Source: Conbersa, How Much Time Do People Spend on Social Media in 2026?
Social Media Platform Wars: Who’s Actually Winning in India
If you’d asked five years ago which platform ruled India’s social feeds, the answer was obvious: Facebook, hands down. That’s not true anymore, and the shift happened faster than most marketers expected.
Social Media Market Share tells the “Who’s Winning” Story
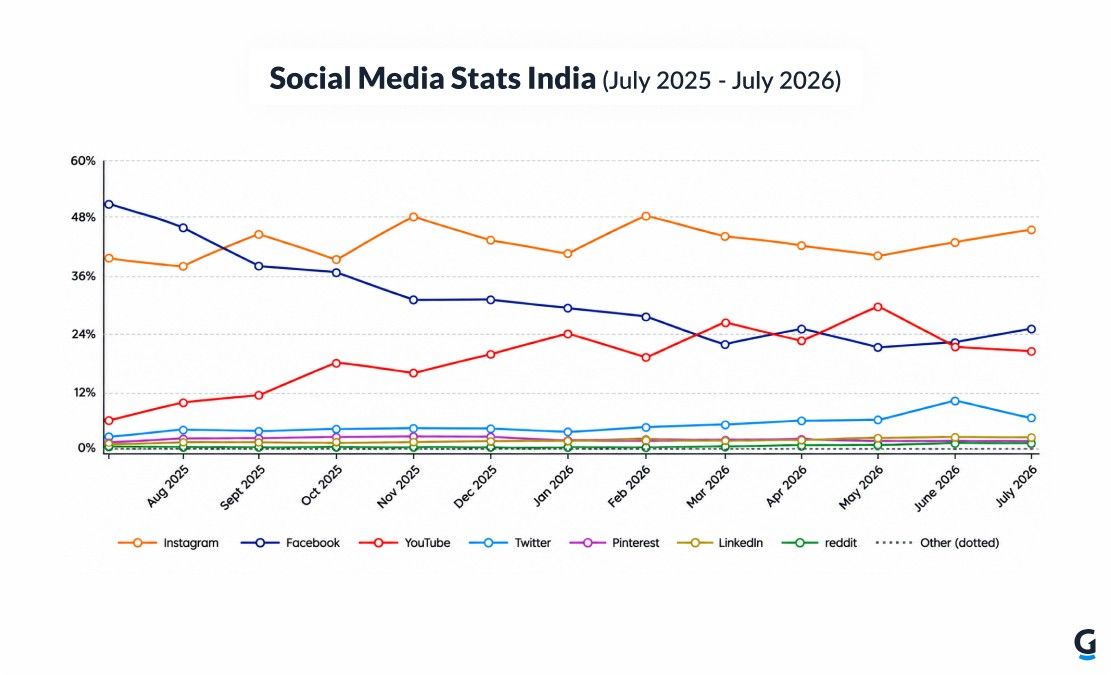
As of June 2026, Instagram holds the top spot with 42.44% of India’s social media market share, followed by Facebook at 21.67% and YouTube close behind at 20.94%. Twitter trails at 10.58%, with Pinterest and LinkedIn rounding out the list at 1.33% and 1.88% respectively. Instagram didn’t just edge past Facebook; it nearly doubled its lead, a reversal that’s reshaped where brands and creators put their energy.
A year earlier, Facebook still held 46.7% of the market compared with Instagram’s 36.48%, showing how quickly the balance shifted between June 2025 and June 2026. That swing is what makes the current ranking so notable: Facebook’s share fell sharply, while Instagram gained enough to move into first place.
Takeaway for affiliate marketers: Instagram’s rise isn’t just a vanity metric; it’s where the attention has actually moved, which means it’s also where product discovery is happening first now. If your affiliate content and links are still weighted toward Facebook the way they were two years ago, this is the signal to rebalance toward Instagram-first placements, without dropping Facebook entirely.
Source: Statcounter Global Stats (2026)
Social Media Users in India by Platform
Market share is about relative dominance, but raw user counts show you the real size of each audience. YouTube actually leads here with 500 million users in India, equal to 34.1% of the population. Instagram isn’t far off at 481 million (32.8%), and it’s still growing fast, up 89.5 million users in a single year. Facebook holds steady at 403 million users (27.5%), also still adding numbers, not shrinking, despite losing market share to Instagram.
Further down the list: Snapchat sits at 213 million users, LinkedIn at 170 million registered members (worth noting that that’s total members, not active monthly users, so it’s not directly comparable to the others), Threads at 26.6 million, Reddit at 30.8 million, and X trailing at just 22.2 million, having actually lost ground over the past year.
| Platform | Users | % of Population |
| YouTube | 500 million | 34.1% |
| 481 million | 32.8% | |
| 403 million | 27.5% | |
| Snapchat | 213 million | 14.5% |
| 170 million* | 11.6% | |
| Threads | 26.6 million | 1.8% |
| 30.8 million | 2.1% | |
| X | 22.2 million | 1.5% |
| Messenger | 108 million | 7.4% |
Note: LinkedIn’s figure reflects total registered members, not active users. So it’s not directly comparable to the other platforms in this table.
Takeaway for affiliate marketers: Share and scale tell different stories, and both matter here. YouTube’s raw size is a reminder that video-first discovery- reviews, unboxing, comparison content reaches more people in India than any single platform, even the one “winning” on share. Meanwhile, Facebook’s real audience of 403 million is proof that a platform can lose the popularity race and still be too big to skip for affiliate reach.
Source: DataReportal, Digital 2026: India (2026)
Which Is the Favorite Social Media Platform?
Market share tells you who’s using what. It doesn’t tell you who people actually love using. That’s a different question, and the answer might surprise you. A quick note: this data is global, not India-specific.
Globally, WhatsApp is the most-loved social platform, with 17.4% of social media users aged 16 and above naming it their favorite, roughly 1 in 6 people. Instagram comes in a close second at 16.4%, and Facebook rounds out the top three at 13%. Together, the top two options alone account for 1 in 3 users’ votes.
Age changes the picture sharply. Instagram is the clear favorite among users aged 16 to 34, while WhatsApp only takes the top spot once people cross 35. That split matters if you’re deciding where to focus content for a younger versus an older audience.
Takeaway for affiliate marketers: Being someone’s favorite platform isn’t the same as being where they spend the most time or click the most. But it does mean it’s the platform they trust and return to voluntarily. Instagram’s dominance among under-35s reinforces what the rest of this blog already points to: if your audience is young, Instagram is where both attention and affection are, which makes it a safer long-term bet than chasing whichever platform is trending this year.
Source: DataReportal, Digital 2026: Global Overview Report (2026)
Best Social Media Platforms for Affiliate Marketing CTR
A quick note: unlike the market share and user numbers you’ve seen so far, click-through rate isn’t something Statcounter or DataReportal track platform by platform for India specifically. What follows is based on affiliate and social advertising benchmarks compiled globally. It is useful for spotting which platforms tend to convert scrolls into clicks, even without an India-specific figure attached.
Pinterest consistently posts the highest organic outbound CTR of any major social platform, with benchmarks putting it around 1.54%, ahead of Facebook (1.21%) and X (0.86%). That’s largely down to intent. People use Pinterest to actively save and click through toward a purchase, not just to pass time scrolling. Facebook and Instagram ad CTRs show a much wider range, anywhere from roughly 0.5% to over 7%, depending on targeting, creative quality, and season, per affiliate marketing benchmark data.
| Platform | Avg. Engagement Rate | Avg. CTR | Avg. Follower Growth/Month |
| TikTok | 2.65% | 0.84% | 2.5-5% |
| 2.13% | 0.67% | 1-3% | |
| 1.16% | 0.68% | 1-2.5% | |
| 0.06% | 1.21% | 0.5-1% | |
| Twitter/X | 0.029% | 0.86% | 0.5-1.5% |
| 0.11% | 1.54% | 1-3% | |
| YouTube | 1.7% | 4-5% (CTR on thumbnails) | 1-2% |
Takeaway for affiliate marketers: Don’t assume the platform with the biggest audience sends you the most clicks. A smaller, intent-driven audience, like Pinterest’s, can convert better than a much larger audience that’s scrolling for entertainment first and shopping second.
Sources: Post Affiliate Pro (2025), SocialRails (2026)
How to Use These Numbers
Put all of this together, and the picture is simple: India’s social media audience is enormous, still growing, young, spends real time on Instagram and YouTube specifically, and increasingly treats social feeds as a shopping aisle rather than just a scrapbook.
For affiliate marketers, that means the gap between discovery and checkout is shrinking. Someone scrolling Instagram today, clicking on a product, and buying it is becoming a normal purchase path. The earlier your content shows up in that path, on the right platform and in the right format, the more audience you can capture.
FAQs
How many social media users are there in India?
Estimates vary by source and methodology, but according to Statista, it is somewhere between 650-700 million, which works out to around 64% of the population.
Which social media platform is most popular in India?
Instagram holds the top spot by market share as of June 2026, at 42.44%, having overtaken Facebook. By raw user numbers, though, YouTube leads with 500 million users and can be a prime earning spot for affiliate marketers.
How much time do Indians spend on social media daily?
The average Indian spends over 2.4 hours a day on social platforms, according to DataReportal.
How many smartphone users are there in India?
India has around 750 million active smartphones, making it the world’s second-largest smartphone market after China.
Is Instagram bigger than Facebook in India?
By market share, yes, Instagram passed Facebook in 2026. By raw user count, Facebook still holds a larger base.
Which age group uses social media the most in India?
Adults aged 18-35 are the most active demographic across nearly every major platform in India.
Which social media platform is best for affiliate marketing?
There’s no single answer; it depends on the goal. Instagram leads on both market share and audience favorability in India, making it strong for reach and trust. Pinterest posts the highest organic click-through rate of any platform, making it stronger for intent-driven conversions. YouTube’s massive raw user base makes it hard to ignore for video-based product discovery. Most affiliate marketers get the best results by matching the platform to the content format rather than picking just one.